±1.5 in
TIDE MODEL ERROR VS REAL NOAA GAUGES
 PISCES
THE METHODOLOGY
Pisces is built from published scientific data and checked against real instruments. This page lays out what goes in, how well it performs, and where the limits are.
WHAT GOES IN
Every layer of the forecast starts from published, citable scientific sources. Nothing crowd-sourced.
NOAA CONED TOPOBATHY DEM
NOAA's lidar-derived elevation model of the Carolinas at 1-meter resolution: over 200 million depth measurements on our first water alone, including skinny water no sonar boat has ever surveyed.
NOAA CO-OPS STATIONS
Real tide gauges and published datums from NOAA's Center for Operational Oceanographic Products and Services. These are the instruments the tide model is checked against.
NATIONAL WEATHER SERVICE
NWS forecast data drives the water-temperature model, and station history going back more than a decade is what it was tested on.
PUBLISHED FISHERIES SCIENCE
Species behavior comes from state stock assessments and peer-reviewed biology from NOAA and North Carolina marine science, with a documented source trail for every species we forecast.
ALSO IN THE STACK: NOAA ELECTRONIC CHARTS · USFWS WETLANDS INVENTORY · USDA NAIP IMAGERY
THE NUMBERS, EXPLAINED
The tide model reproduces water levels across the whole sound within about an inch and a half of NOAA's gauges. The water-temperature model was backtested on years of held-out station data: 1.2 °C error, against 1.7 °C for the simple assumption that tomorrow equals today.
THE HARD TEST
Most models are graded on water they trained on. The Pisces seafloor classifier is graded on water it has never seen: 68% there, 74% the easy way. We use the 68, and the app shows the confidence behind every forecast, spot by spot.
HOW IT'S CHECKED
01 — REAL INSTRUMENTS
Accuracy is measured against NOAA gauges and held-out data the models never saw.
02 — BUILD GATES
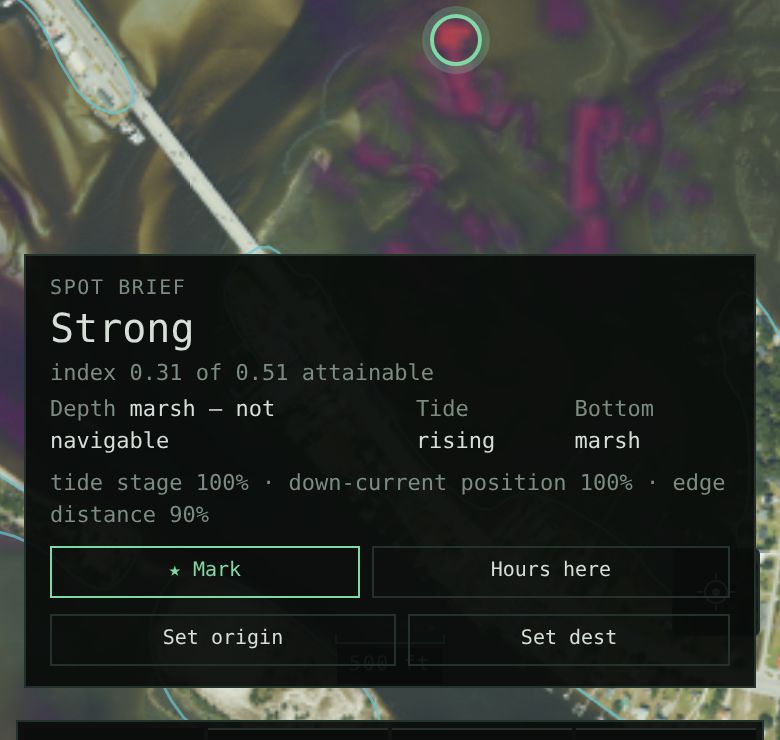
Physical sanity checks run on every build. If the water stops making sense (marsh below low tide, a datum out of place), the build fails.
03 — CONFIDENCE ON SCREEN
Every forecast carries its data confidence. Where the survey is old or the signal is weak, the app says so.
04 — EMPTY WATER
Where a fish can't live, the score is zero and the map stays dark. We'd rather show you less than make something up.
THE LIMITS
Pisces shows where conditions favor fish, and why: depth, tide stage, structure, season. It can't guarantee a catch, and it isn't navigation advice: depth data carries the accuracy of the surveys behind it, and the app discloses that everywhere depth is shown.
COVERAGE
Every water body gets the full treatment (seafloor, tide model, verification) before it ships. Bogue Sound, North Carolina is first, and coverage expands along the coast from there. The early-access list hears first as each water comes online.

EARLY ACCESS
Launching 2026 on US coastal waters, starting with Bogue Sound, North Carolina.
LAUNCH UPDATES ONLY. UNSUBSCRIBE ANYTIME.